With the right approach, data can be transformative. In the following blog, we’ve unpacked our methods of collecting, sorting, and analyzing data. From our insights into our epic School Photography Industry report to general data collection tips and tricks, it’s a true behind-the-scenes glimpse. So go forth, read, and learn how to get the most out of your data!
The School Photography Report
As a collaboration with SPOA, we’ve created the School Photography Industry Report to aid the understanding of the dynamics of the school photography industry. Over the past two years, we’ve surveyed over 74,000 parents in every state of the USA and reached 2,500 educators. Through our survey, we strive to promote industry growth and innovation by equipping photography companies with readily available data and usable insights. It’s an annual report to provide insights into the industry because, without data, we are only guessing. Want to view the report? Click here.
Use these insights to evaluate your business and the potential untapped opportunities in our industry.
Key takeaways from this year’s report:
- Price, quality, and variety are still trending as crucial factors in meeting customer expectations
- Customization and convenience are emerging as pivotal factors in achieving customer satisfaction and increasing perceived value
- Ease, digital products, alternate payment methods, and an excellent shopping cart user experience are highly desired by customers
New this year
Let me tell you, the latest addition to this year’s insights report, titled ‘New Data, New Insights,’ is an absolute game-changer. It’s a direct result of incorporating invaluable feedback from our previous report and leveraging the freshest data available for this year.
What’s truly exciting is the emergence of new focus areas that demand our attention; in a world where choice, customization, and convenience reign supreme, these elements have taken center stage like never before. They’re not just important; they’re vital.
We’ve got our finger on the pulse of this dynamic industry, and this year’s insights report is here to show you the underlying patterns and key drivers that shape our industry. What makes it even more exciting is that you can harness these insights as a powerful tool to dissect your business and uncover the treasure trove of uncharted opportunities waiting to be seized.
While we’re here, check out these insights!
Customization
- 62% of photography companies provide custom background options
- 74% of parents want to create their own package
- Our findings reveal that 71% of parents favor basic color backgrounds, 57% appreciate textured backgrounds, and 40% lean towards themed backgrounds
Technology
- A staggering 53% of parents now seek to utilize their child’s school photos as digital products
- Almost half of parents want a digital product included in a package
- 55% of parents want to include custom backgrounds when purchasing digital products
Communication
- Teachers surveyed believe that 31% of parents prepay with paper order forms, while only 9% of parents did
- Parents want to “ship to school for free,” whereas Teachers want to “ship to home for a small fee”
- Parents and Teachers are not on the same page when it comes to knowing how much parents are actually spending on school photos
With this wealth of knowledge, your school photography company can now better meet the needs and expectations of parents and schools through making data-informed decisions. However, these are not strategies. So, see how these insights can work for your company with the nuances of your own business in mind.
Next year’s report
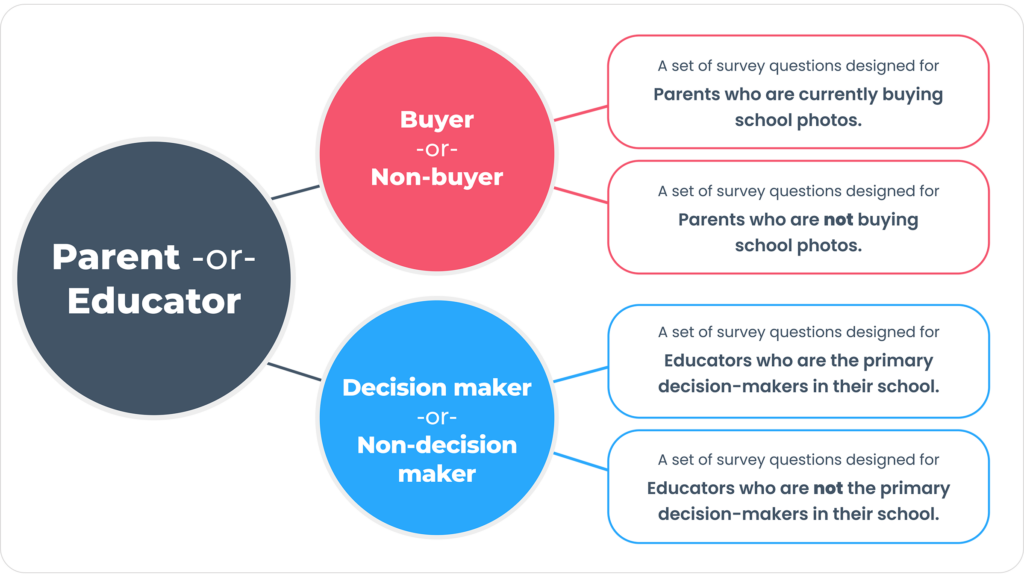
The School Photography Industry Report will be back in 2024 and is set to be our biggest year yet! We’ll strive to understand what motivates non-buyers and focus on educator decision-makers. Increasing the survey time frame to 12 months, from January 2024 to December 2024, we aim to capture seasonal information while facilitating growth in overall participation.
But how can I use this data to inform my decision for Fall 2024!? Don’t worry; we have you covered! An interim report will be produced in July 2024, delivered at SPOA 2024, and sent to Fotomerchant customers and SPOA members. This will provide a snapshot of the data and an overview of the emerging stand-out trends.

There you have it! The School Photography Industry Report is a crucial guide for businesses in the dynamic school photo and yearbook industry. Surveying thousands of parents and educators, the report unveils current trends and provides detailed insights. The rise of customization and the increasing demand for digital products underscore the evolving landscape of customer preferences and expectations. It goes beyond industry understanding, acting as a powerful tool to discover untapped opportunities within your business.
Advocating for a ‘data-informed’ approach, the report recognizes the synergy of data and human experience for optimal results, fostering a culture of data collaboration and strategic decision-making. It’s not merely a snapshot of the industry; it’s a dynamic tool empowering your business to navigate change, seize opportunities, and align decisions with the evolving needs of parents, educators, and the industry.
Data-Driven vs Data-Informed
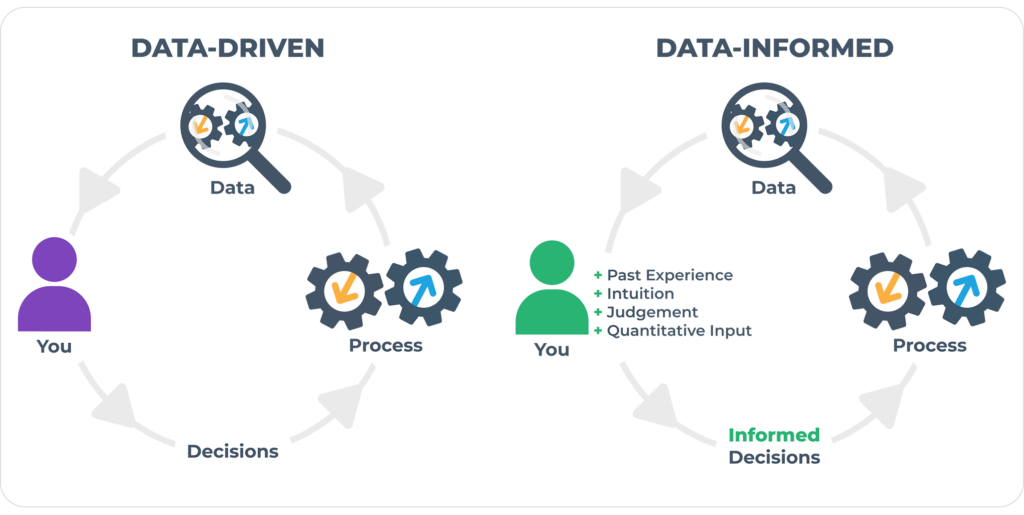
Chances are, you’re familiar with the term ‘data-driven,’ a methodology where data, devoid of human presumptions or external influences, exclusively guide decisions. While this approach has its merits, it may not be optimal for every business.
In our journey, we’ve found that embracing a ‘data-informed’ approach resonates more with our ethos. This nuanced strategy allows us to leverage data as a valuable tool, incorporating it into our decision-making process while keeping sight of the valuable insights that human experience and intuition bring to the table.
In essence, the implementation of a data-informed approach has not only optimized our operational efficiency but has also reinforced a culture that is built on data collaboration and strategic decision-making across our organization.

Data “Rule of Thumb”
Now, you might wonder, how can I transform my studio into a data-informed business? Let’s pull back the curtain and explore our approach to data. Follow along to gather valuable tips for integrating data-informed decision-making into your repertoire.
- When diving into data analysis and whipping up a report, stick to the basics for a great result. Set crystal-clear goals, so you’re not just spinning your wheels. Keep your data honest – check sources and don’t let any sneaky errors slip through.
- When it’s showtime, pick visuals that are as spot-on as your grandma’s apple pie. Keep it simple, though – no need for brain-busting complexity. Explain why your data matters – give it some context. And don’t forget to shine a spotlight on the real stars of the show – those key insights that make your data sing.
- Uniformity is your sidekick, so stick to a consistent style. Make it easy on the eyes with clear labels and jargon-free zones. Craft a story from your data; take your reader on a journey from the beginning to the lightbulb moments. And when you wrap it up, serve some actionable advice on a silver platter.
So, next time you’re crunching numbers, follow these tips and get the most out of your data!
That’s all for now, folks!
Ready to embark on your data journey? Unpack the treasure trove of tools we’ve shared in this blog. Combine your discoveries with insights from our report to make your studio an unstoppable force. For a deeper dive, check out our “Generating and Analyzing Reports” blog; your passport to unlocking the full potential of our Commerce reporting hub. Armed with savvy decisions, let the excitement of discovery fuel your path. Every click counts, and every report tells a tale.
This journey is possible because of YOU. Thank you! Eager to contribute? Get in touch with our legendary team about becoming a survey distributor or question creator. Together, let’s chart a course toward a future where data-informed decision-making steers our industry and propels it to new heights of success.


